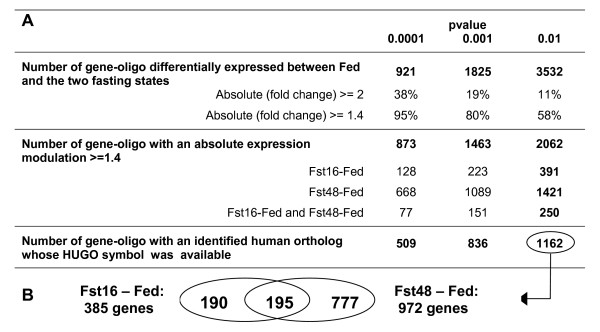
Figure 1.
Genes differentially expressed between Fed and the two fasting Fst16 and Fst48 states. A: Number of genes differentially expressed according to the pvalues corrected by Benjamini-Hochberg. B: Venn diagram for the genes differentially expressed (pvalue < 0.01) in the two contrasts "16 h of fasting versus the fed state" (Fst16-Fed) and "48 h of fasting versus the fed state" (Fst48-Fed).

