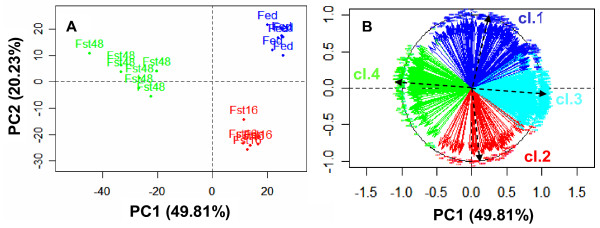
Figure 3.
Principal Component Analysis (PCA) of the gene selection. The gene variables for the PCA were scaled to give them the same importance. A: individual factor map; B: gene factor map, only the genes highly correlated to the first two components are indicated (r > 0.7). The gene color was determined according to their HCA cluster (cl.i = cluster i).

