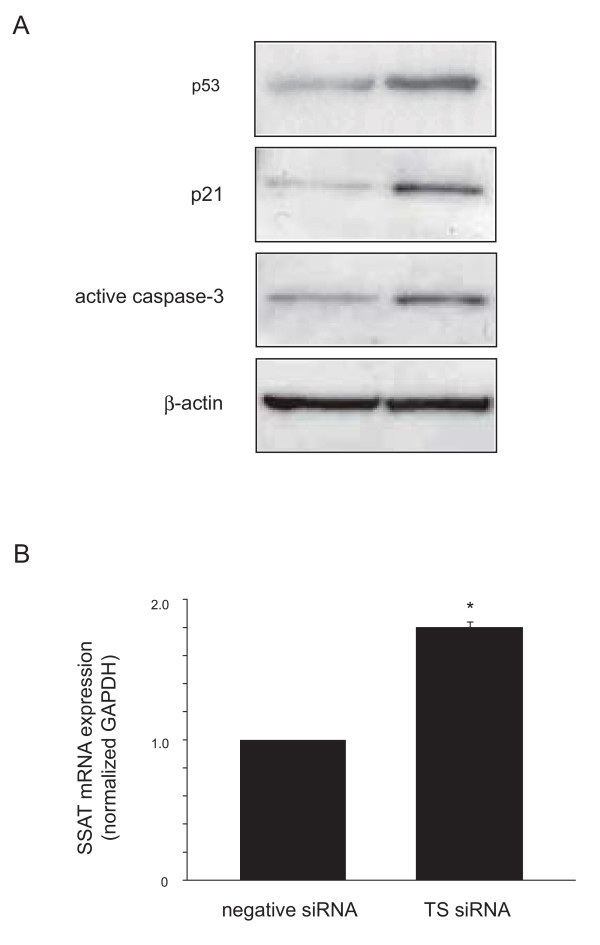
Figure 4.
Effect of TS silence on expression of p53, p21, active caspase-3, and SSAT. Cells were transfected with each siRNA for 48 h and then protein and mRNA transcript expression was analyzed by Western blot (A) and real-time quantitative RT-PCR (B). The results are expressed as mean ± SD. *, P < 0.01, significantly different from control.

