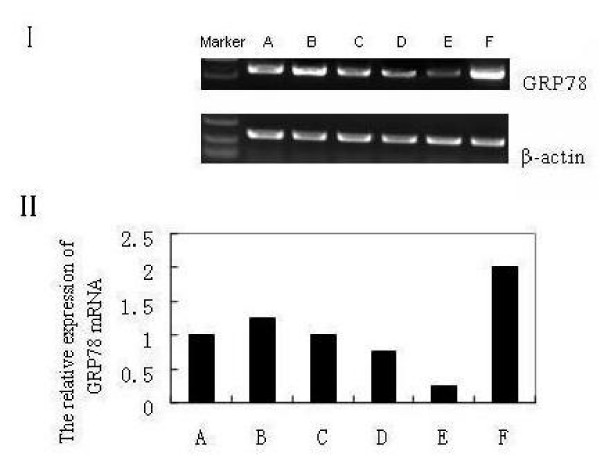
Figure 1.
The results of GRP78 RT-PCR products for the NCI-H446 cells. (A): untreated (control) cells; (B-E): cells treated with BAPTA-AM at 10 μM (B), 15 μM (C), 25 μM (D), 40 μM (E) for 2 h respectively, prior to the addition of A23187 at 2 μM for 24 h; (F): cells treated with 2 μM A23187 alone for 24 h. I: Electrophoregram II: Bar graph.

