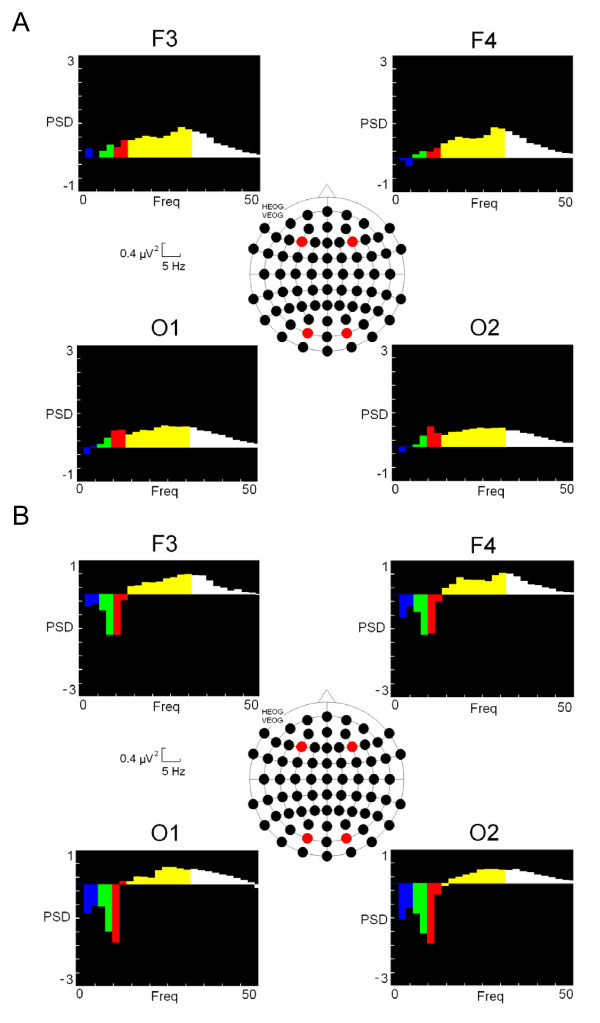
Figure 2.
Power Spectral Density (PSD) of different bands. Different colours represent every spectral band (delta (0.5 – 4 Hz): blue colour; theta (5 – 8): green; alpha (9 – 12 Hz): red; beta (13 – 30 Hz): yellow and gamma (31 – 45 Hz): white. A) Subtraction of RRMS scores from control values. B) Subtraction of BMS scores from control values. CON: Control group; RRMS: relapsing-remitting group; BMS: Benign group.

