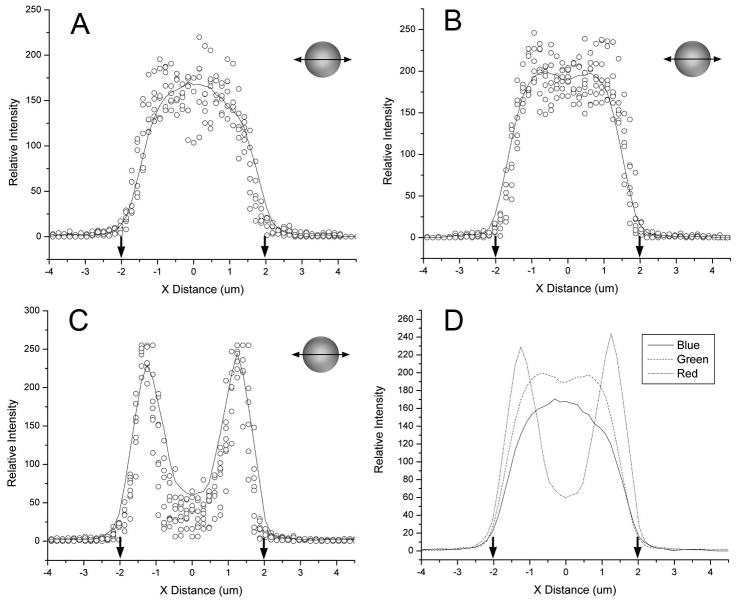
Figure 1.
Quantitative morphometry of the x-axis (transverse) dimension of 3D reconstructed microspheres after structured illumination acquisition. Linescans from a minimim of 5 blue (A), green (B), and red (C) spheres are shown as raw data (open circles) and summarized with a smoothing curve (line) based on a 5 point adjacent average. (D) The smoothing curves for all three fluorochromes were superimposed for precision comparison. The diameter of the microsphere based on manufacturer specifications, is shown (arrows). Of note, the linescan of the rhodamine (C) labeled microspheres was bimodal reflecting the limited penetration of the dye into the polypropylene microspheres. The structured illumination images of micropheres suspended in glycerol were obtained with 40x oil immersion objective using selective blue (ex 360/40nm; em 420nm LP), green (ex 480/40nm; em 535/25nm) and red (ex 540/25nm; em 620/60nm) fluoresence filters.

