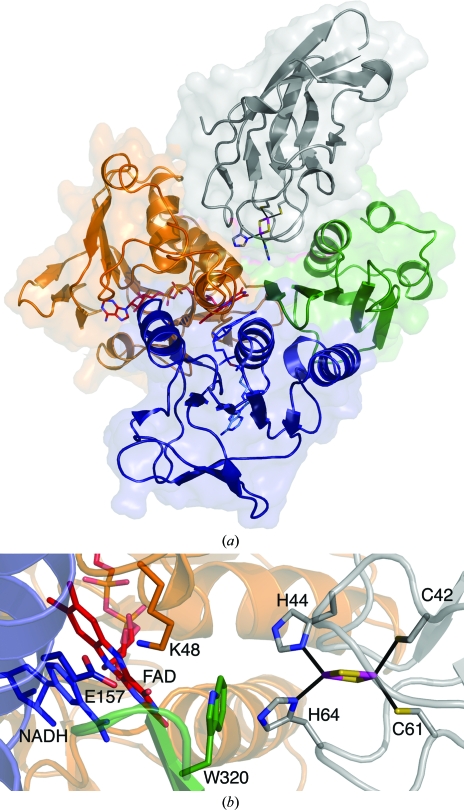
Figure 4.
Modeled interactions between TDO-R and TDO-F. The FAD-binding domain, NADH-binding domain and C-terminal domain of the TDO-R are colored orange, blue and green, respectively. FAD (red) and NADH (blue) are shown in stick representation. NADH has been modeled in the NADH-binding pocket based on the structure of BPDO-RKKS102. TDO-F is colored gray and the Rieske iron–sulfur cluster with its coordinating residues is shown in stick representation. (a) Overall representation of a possible binding site for TDO-F between the FAD-binding and C-terminal domains of TDO-R. (b) Close-up of the modeled interactions for electron transfer between TDO-R and TDO-F via FAD and Trp320 of TDO-R. Two residues (Lys48 and Glu157) that are believed to be involved in hydride transfer in GR and BPDO-RKKS102 are represented. This figure was produced using PyMOL (http://www.pymol.org).

