Figure 1.
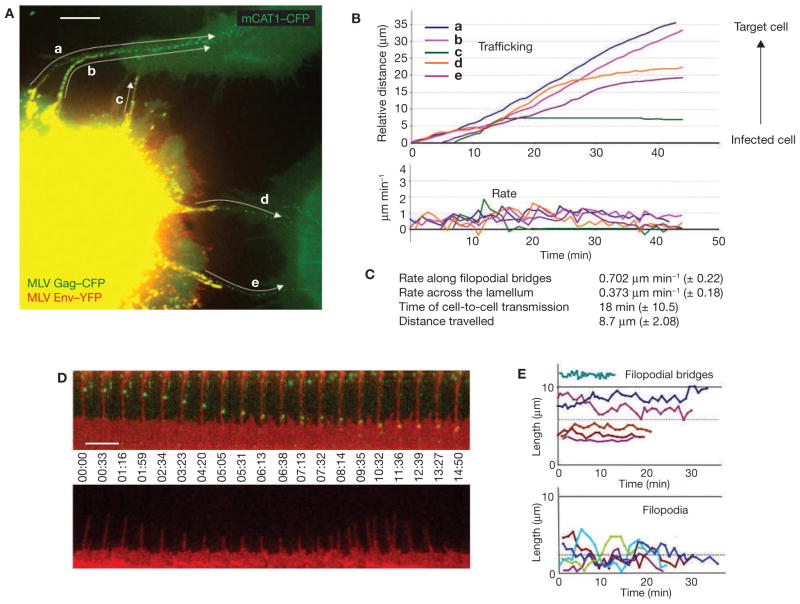
MLV moves from cell-to-cell along filopodial bridges. (A) Cos-1 cells generating infectious MLV labelled with Gag–CFP (green) and Env–YFP (red) were cocultured with target XC cells expressing mCAT1–CFP (green) and monitored by time-lapse microscopy. To illustrate the overall movement of viruses from cell to cell, 22 frames of the Supplementary Information, Movie 1 were superimposed. Arrows indicate the paths of five viral particles (a–e) undergoing transmission. (B) Single-particle tracking of particles a–e (shown in A) moving from the infected cell towards the non-infected target cells. (C) Average rates of particle movement, average transmission time and average distance travelled for 117 MLV particles undergoing cytonemal transmission. (D) Two arrays of individual frames from a time-lapse video covering approximately 15 min compare the stability of a filopodial bridge (upper panel; red, mCAT1–YFP) transporting viruses (green, MLV Gag–CFP) to that of an unanchored filopodium (lower panel). (E) Graphs indicating the lengths of five filopodial bridges compared with unanchored filopodia over time. The dotted lines represent the average length of either structure (5.8 ± 2.84 μm, n = 59 versus 2.37 ± 1.67 μm, n = 60). The scale bars represent 10 μm in A and 5 μm in D.

