
Figure 2.
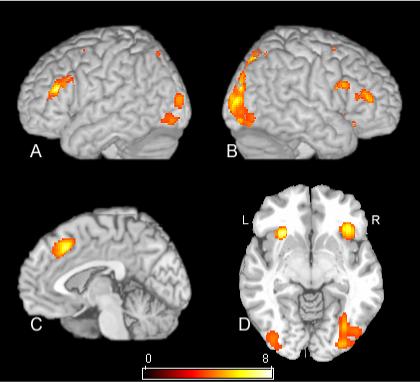
SPM[t] contrast of ESD versus EVD conditions. The map in this figure has a statistical threshold of p<.02 using the false discovery rate correction procedure described in the text. Rendered views of the left and right hemisphere are shown in A and B respectively. C is a mid-sagittal view, and D is an axial view just below the commissures. See Table 1 for cluster locations and voxel level statistics.