
Figure 4.
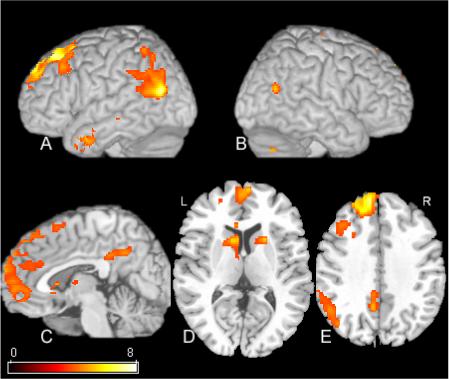
SPM[t] contrast of ISD versus ESD conditions. The results are thresholded at a statistical threshold of .02 FDR corrected. Rendered views of the left and right hemisphere are shown in A and B respectively. C is a mid-sagittal view depicting AMPFC and RSC activation. D-E are axial views. See Table 3 for cluster locations and voxel-level statistics.