
Figure 5.
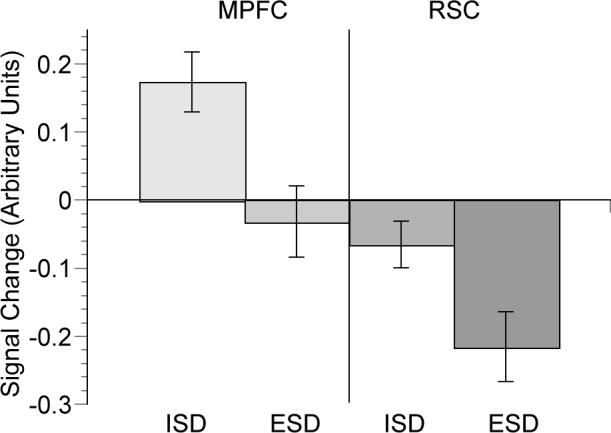
Plot of the eigenvariate of signal change averaged over seven voxels defined by a 2mm radius sphere in the anterior medial prefrontal cortex (coordinate −12, 50, 34) and retrosplenial cortex (−8, −40, 32) for ISD and ESD conditions relative to the EVD condition. Error bars represent the standard error.