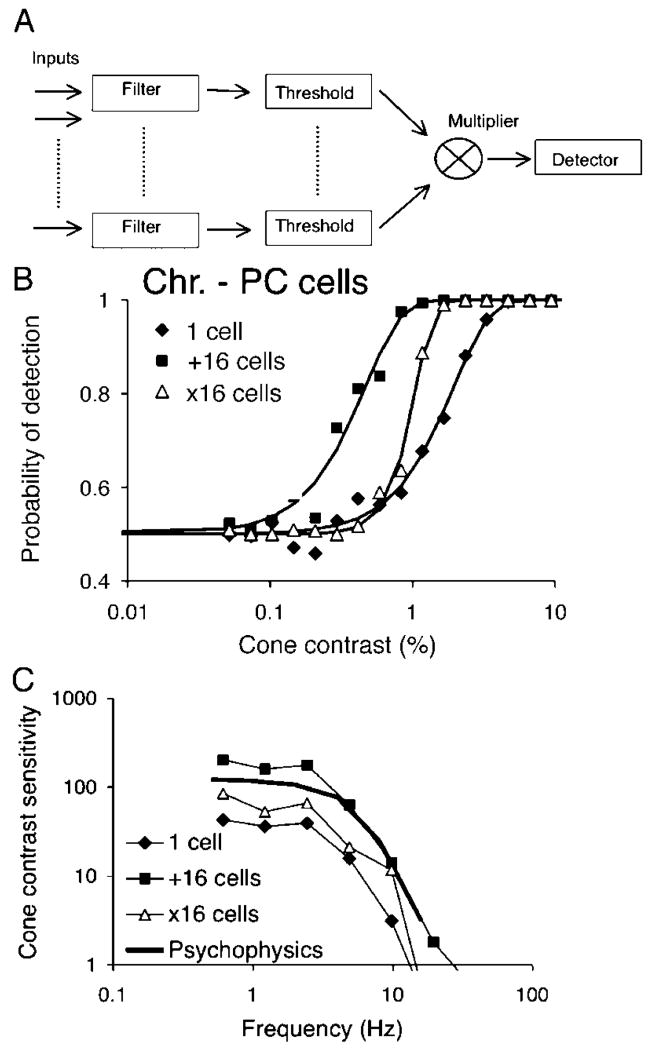
Figure 10.
Possible scheme for increase in slope of fit of Weibull function to neurometric analysis. (A) Analog cell signals are filtered, subject to a thresholding mechanism and multiplied. The resulting output is subject to the differencing procedure described in previous figures. (B) Comparison of frequency of detection functions for a single cell, summed signals of 16 cells, and a combination of 16 cells used as input to the scheme in panel A, which increases slope. (C) PC temporal response to chromatic modulation for the three conditions compared to psychophysical data. The shapes of curves remain similar.

