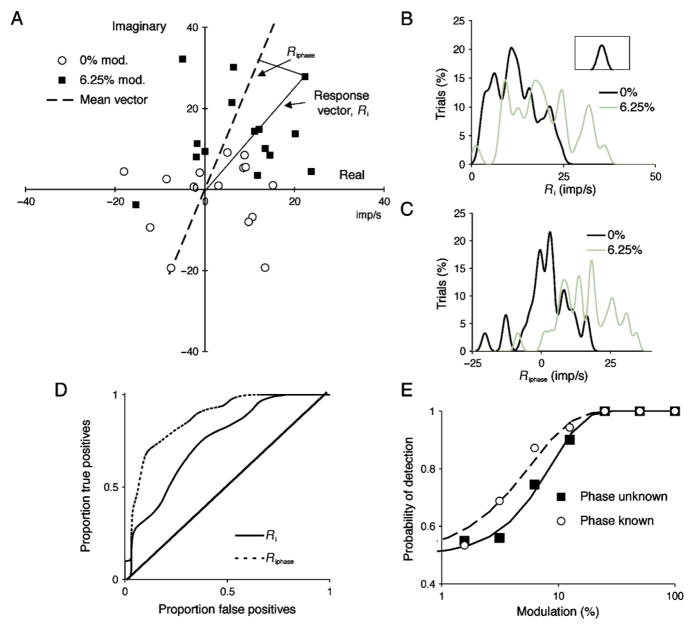
Figure 2.
Single-cell observer analysis. (A) Responses of +L−M parvocellular (PC) cell to 4.88 Hz chromatic modulation, at 0% and 6.25% contrast. Responses at 0% contrast cluster around zero, at 6.25% they are displaced from zero with some overlap. For each response, the vector Ri was used in subsequent analysis. Alternatively, the response component along the mean vector (Riphase) was used. Only a subset of the 30 cycles recorded for each contrast is shown for clarity. (B, C) Amplitude values were cumulated after smoothing with the inset Gaussian. The cumulative distributions for all sweeps are shown for the two contrasts (0% and 6.25%). (D) The cumulative proportion of signal plotted relative to noise as the response measures (Ri or Riphase) increase for a given contrast (in this case 6.25%) provides an receiver operating characteristic (ROC) curve. The abscissa represents proportion of false-positives (false alarms) and the ordinate true positives (hits). The diagonal indicates a contrast of zero. (E) The area under curves as in panel D gives the percent correct of detection based on a single cell in a two-alternative forced choice situation. This is plotted against contrast and was fitted with a Weibull function using maximum likelihood estimation. The curve for the known phase condition is shifted leftward compared to the unknown phase condition, indicating that knowing response phase increases detectability.

