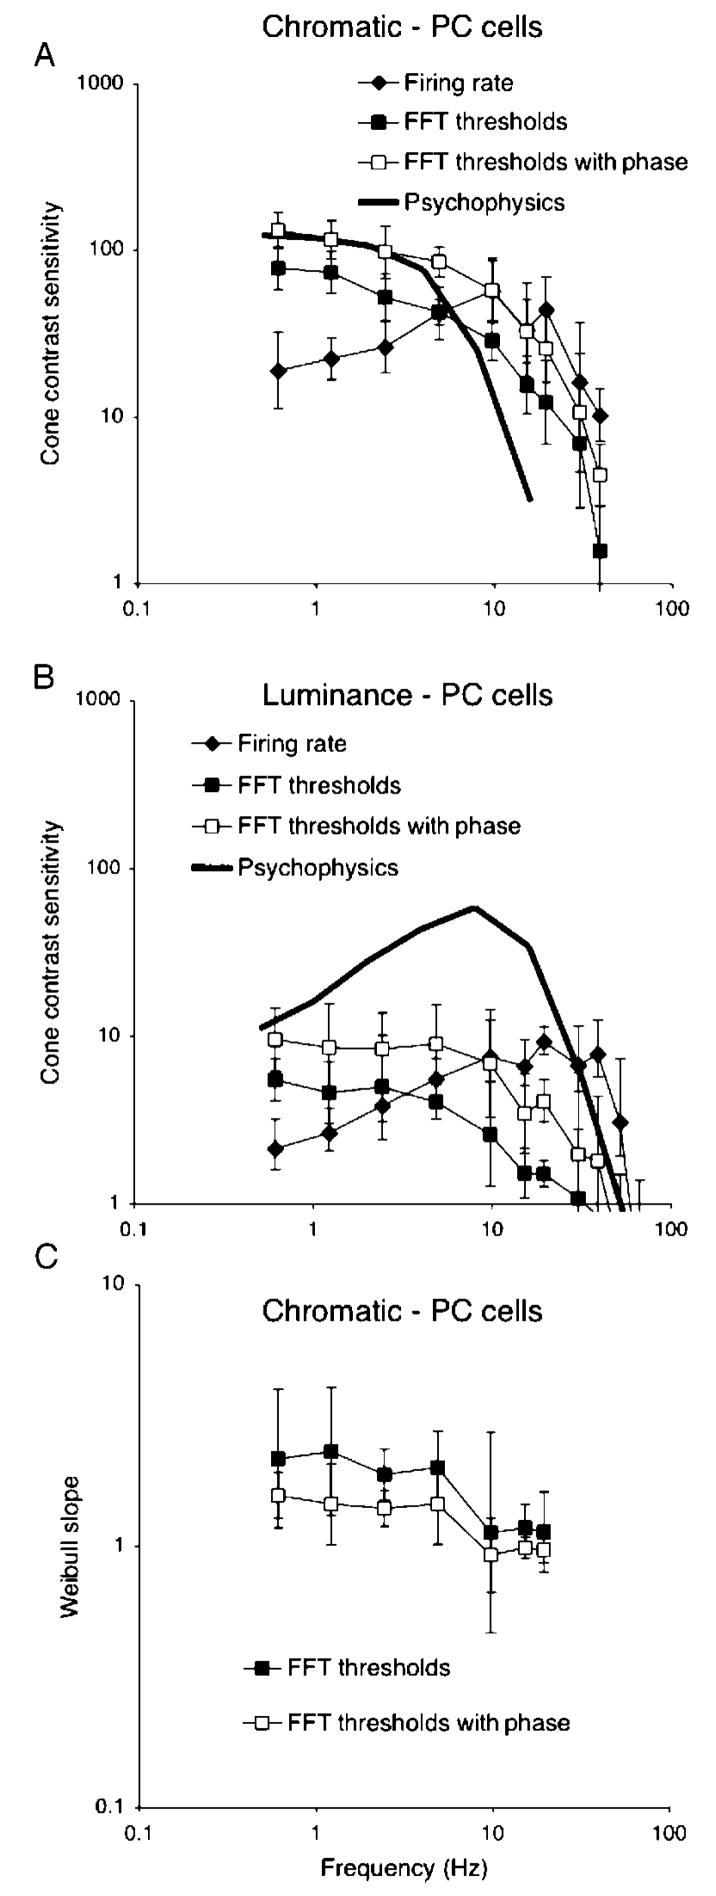
Figure 3.
(A, B) Parvocellular (PC) cell and psychophysical sensitivity to chromatic and luminance modulation. Each point is the average of 5 cells (combined +M−L and +L−M). Sensitivity has been converted to cone contrast using the cone fundamentals. Thresholds derived for a 20 imp/s modulation in firing (firing rate) and two forms of neurometric analysis for a single-cell observer, either with unknown or known response phase, are shown. In this and subsequent figures, error bars indicate standard deviations of cell samples. Also shown are psychophysical thresholds for human observers from Swanson et al. (1987). (C) Mean slopes of Weibull function fits for the same cell sample. These values decrease at high temporal frequencies.

