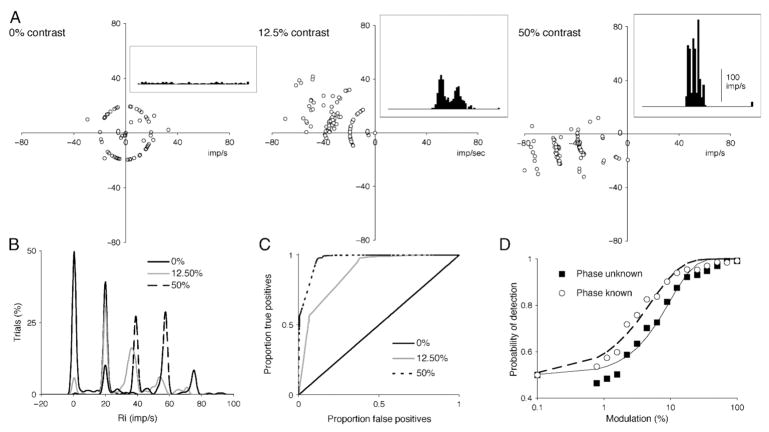
Figure 4.
Distributions of Fourier coefficients of magnocellular (MC) cells at high frequency (luminance modulation, 19.5 Hz in illustration). (A) Results of single-cycle Fourier analysis at 0%, 12.5%, and 50% contrast. Inset histograms show averaged response. Because there are few impulses per cycle, individual points cluster around the circumference of circles representing 1, 2, 3, or 4 impulses per response, or at the origin (0 impulses per response). (B–C) Amplitude distributions were cumulated as in Figure 2. The quantal nature of the impulse distributions results in restricted values for the amplitude distributions, which leads to receiver operating characteristic (ROC) curves made up of combinations of straight-line segments. (D) Resulting frequency-of-detection functions tend to be of shallower slope due to the peculiar statistics of the distributions.

