
Fig. 3.
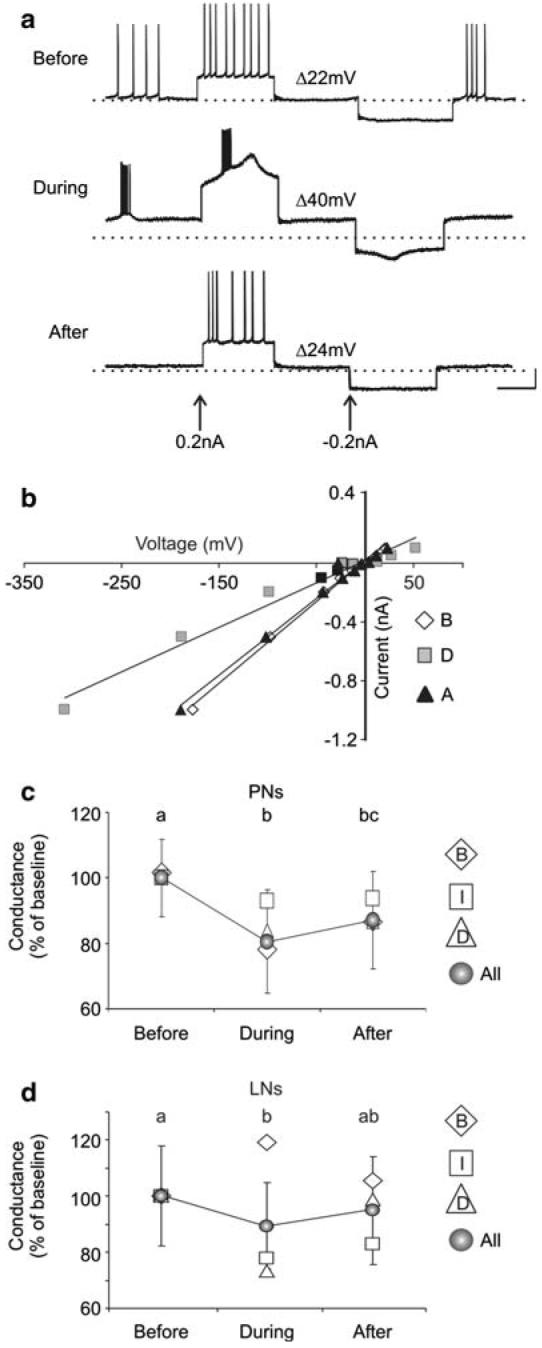
NO inhibition modified resting input resistance in both PNs and LNs. a Current injections during NO inhibition revealed dramatic voltage changes (†V; +45%) in this representative PN (PN1). b The input conductance for PN1, calculated from the slope of the regression line when the peak voltage was plotted against multiple current steps, dropped by 54% (from 5.4 to 3.6 nS) when NO synthesis was inhibited. c The average input conductance for all PNs (all) and by activity class (B bursting; I increased; D decreased) was plotted as a percentage of baseline levels (SEM is only shown for average of all PNs). The average conductance decreased significantly during NOS inhibition (means coded by different lowercase letters differed significantly; n = 12; repeated measures ANOVA df = 2; F = 26.7; P < 0.001; Tukey's post-hoc test: P < 0.001). d The mean conductance decreased significantly for all LNs (n = 8; repeated measures ANOVA df = 2; F = 3.4; P < 0.05; Tukey's post-hoc test: P < 0.01), however the bursting LNs (n = 2) showed an average increase in conductance (+16%). Calibration 20 mV, 500 ms