
Fig. 4.
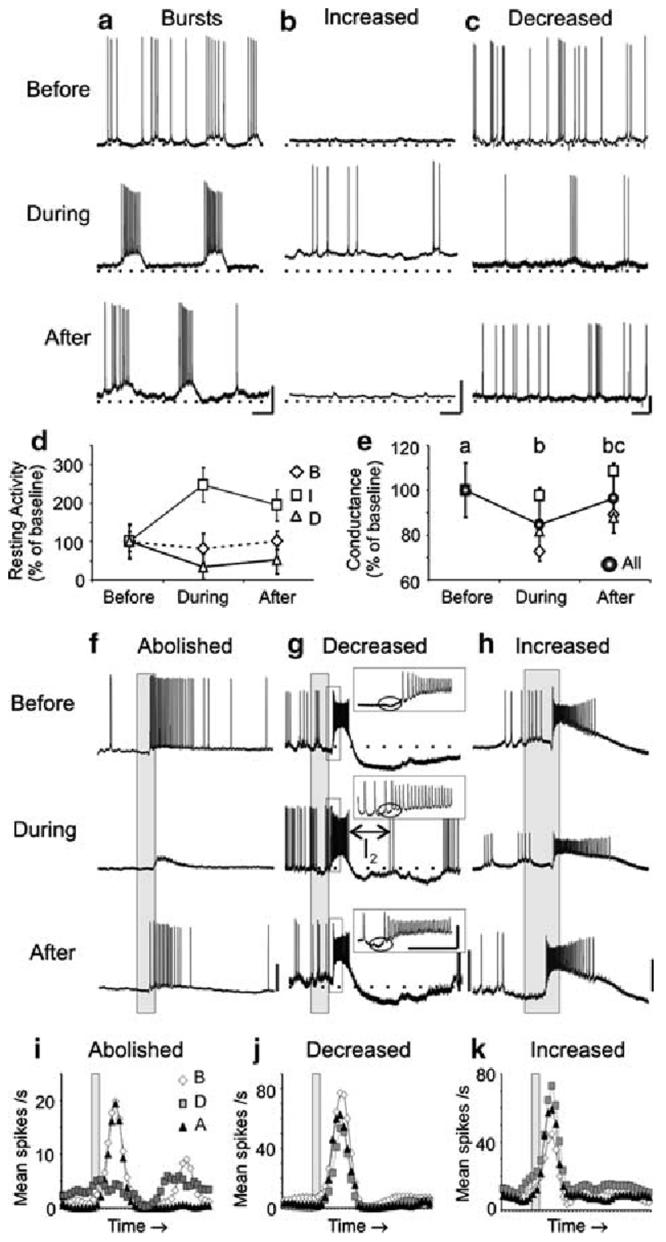
Inhibitors of sGC signaling caused similar modifications as NO synthesis inhibitors in the resting and odor-evoked activity in a subset of PNs. a-c Representative traces are shown for three PNs before, during, and after treatment with 500 μM ODQ. As found with NOS inhibition, sGC inhibition resulted in: rhythmic bursting (a n = 3; PN5 shown, compare to Fig. 1a), increased firing rates (b n = 2; PN12, compare to Fig. 1b), and decreased firing rates (c n = 2; PN27), coupled with changes in the RMP and action potential amplitude in a subset of PNs (a n = 2). d The average resting activity plot revealed the bursting PN firing rate decreased during sGC inhibition, which deviates from the increased firing rate observed in the PNs during NOS inhibition (Fig. 1d). e The average conductance of all PNs decreased significantly during sGC inhibition (n = 6; repeated measures ANOVA df = 2; F = 9.41; P < 0.001; Tukey's post-hoc test: P <0.01). f-k PN odor responses during sGC inhibition were also abolished (f, i; PN 26; n = 3; significance not measured, n < 4), decreased (g, j; PN27; n = 4; df = 2; F = 48.4; P < 0.0001; Tukey's post-hoc test: P < 0.001), and, unlike during NOS inhibition, increased (h, k PN24; n = 4; dF = 2; F = 36.5; P < 0.0001; Tukey's post-hoc test: P < 0.01). g The I1 (inset, circle) and the I2 (see Results) were also modified in this PN during sGC inhibition. Calibration a-c 20 mV and 250 ms; f-k 20 mV and 200 ms (gray bar)