FIGURE 2.
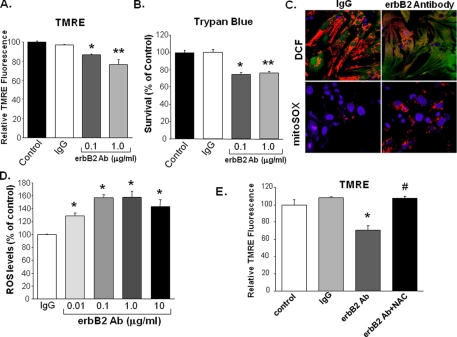
Treatment of NRCM with an erbB2 antibody increases ROS production, and the increase is blocked by treatment with NAC. NRCM were treated with 0.1 or 1 μg/ml of erbB2 antibody, and cell death was measured via (A) TMRE uptake (*, p = 0.017 and **, p = 0.029 compared with IgG, n ≥ 3) or (B) trypan-blue exclusion studies (*, p = 0.016 and **, p = 0.003 compared with IgG, n ≥ 3). C, ROS production was assessed by using confocal microscopy to visualize DCF (top panels, green fluorescence) and mitoSOX (bottom panels, red fluorescence) markers. The top panels were also stained with TMRE to identify mitochondria (red) and the bottom panels were stained with DAPI to identify nuclei (blue). D, quantification of ROS production in cells treated with rabbit pre-immune IgG (control) or erbB2 antibody for 18 h. ROS was detected by flow cytometry for DCF, and results were normalized to control cells treated with 1 μg/ml of IgG (*, p < 0.05 versus IgG; n ≥ 3). E, treatment with 10 mm NAC increases cell survival in the presence of erbB2 Ab. NRCM were treated with erbB2 Ab in the presence and absence of NAC, and viability was measured 24 h later via TMRE uptake (*, p = 0.007 versus IgG; #, p = 0.016 versus erbB2 Ab; n = 3). Data are presented as mean ± S.E.

