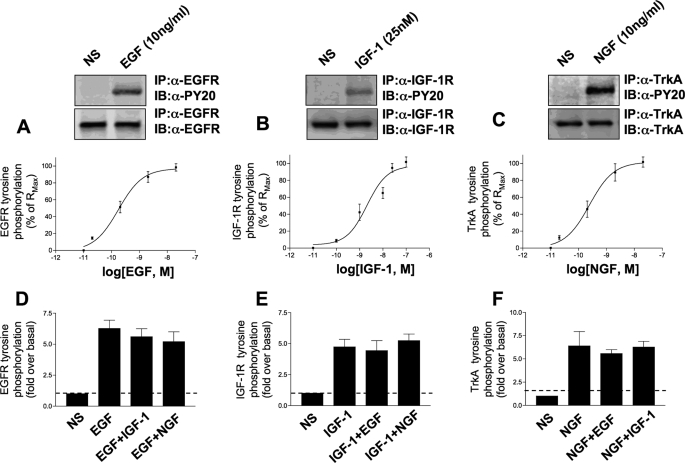
FIGURE 1.
Maximal stimulation of receptor tyrosine kinase signaling systems. A-C depict log dose-response curves for the ligand-induced tyrosine phosphorylation (expressed as a percentage of Rmax) for the EGF (A), IGF-1 (B), or NGF (C) induction of auto-tyrosine phosphorylation of their cognate receptors. Each experimental point upon the dose-response curves is the mean ± S.E. of three independent experiments. Above the dose-response relationships there are representative Western blots of receptor tyrosine kinase immunoprecipitates probed with an anti-phosphotyrosine sera (PY20) or a specific anti-receptor protein sera (for loading control). The doses used for the Western blots were 10 ng/ml for EGF and NGF and 25 nm for IGF-1, which corresponded to the near maximal level of receptor activation. The effect of additional cell stimulation upon discrete ligand-receptor stimulation is depicted in D-F. The simultaneous activation of the two other receptor tyrosine kinase pathways failed to significantly alter the ability of the individual ligands to fully activate its cognate receptor. The bars in the histograms in D-F represent mean ± S.E. receptor tyrosine phosphorylation fold inductions from three independent experiments. IP, immunoprecipitation; IB, immunoblot.

