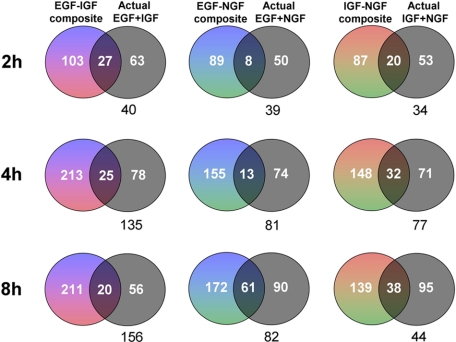
FIGURE 8.
Regulation of PC12 gene transcription by individual and combined stimulations. Venn diagrams demonstrate the numbers of significantly up- or down-regulated genes (p < 0.05) by composites of individual ligand stimulation (mixed colors, EGF = blue; IGF = red; NGF = green) or the actual results of combined ligand mixing (black) at three time points (2, 4, and 8 h) compared with the control gene levels. Commonalities between regulated genes are shown by the inclusion in the Venn diagram intersections. The difference of the gene numbers between composite and actual is shown in black numerals below each Venn diagram.

