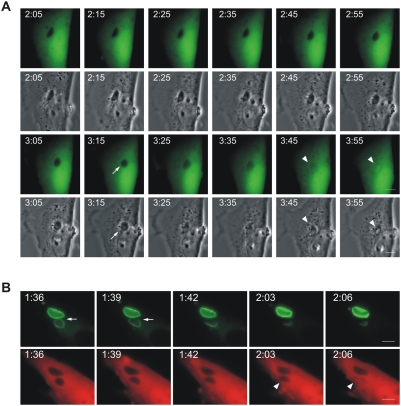
Figure 2. T. gondii is permeabilised in the host cytosol after the disruption of PVM.
(A) MEFs were induced with 200 U/ml IFNγ and transfected with pEGFP. 24 hours later they were infected with ME49 strain T. gondii at an MOI between 5 and 10 for 2 hours and observed microscopically by time-lapse photography. One intracellular parasite was observed throughout the experiment. Images were taken at 5 minute intervals, and selected images from the series (EGFP and phase contrast) are shown. The intracellular T. gondii, initially seen as a dark form excluding EGFP, became permeable to EGFP between 3:45 and 3:55 after infection (arrowheads). At the same time there was a detectable change in the appearance of the parasite in the phase contrast series from dense to light at 3:25 that probably corresponded to the rupture of the vacuole. Arrows indicate the rounding up of T. gondii also noted in Fig. 1A and C. (B) MEFs were treated with IFNγ and co-transfected with Irga6-ctag1-EGFP and pCherry for 24 hours. Cells were then infected with ME49 strain T. gondii for 1 hour and observed by time-lapse microscopy. Two PVs were observed within this cell. Images were taken at 3 minute intervals, and selected images from the series are shown (upper panel Irga6-ctag1-EGFP and lower panel Cherry). The T. gondii PVM was disrupted at 1:39 (arrows) and the parasite was permeabilised at 2:06 (arrowheads). These images partially overlap with and extend the series shown in Fig. 1C. Scale bar: 5 µm. The videos from which these frames were extracted are presented as Videos S3 and S4(Fig. 2A) and S5, S6, S7, and S8(Fig. 2B).

