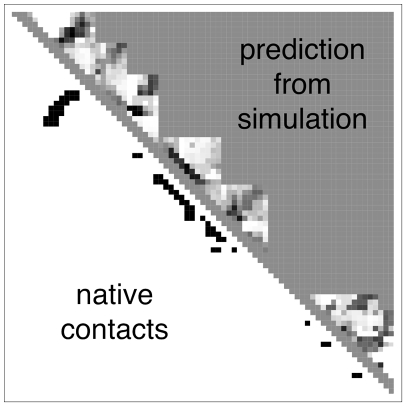
Figure 6. A contact map showing the results of the best 16-mer regression model for an example target, T0363.
Above the diagonal, the grayscale values at each contact position correspond to ‘logit’ values  given by the best logistic regression model trained on all the 16-mer simulation data. The background gray value corresponds to contacts not sampled by the fragment simulations, and is colored according to the logit value threshold
  used for the classification criterion; logit values
  are classified as native and appear darker, while logit values
  are classified as non-native and appear lighter. On the lower diagonal are shown the native contacts in the range sampled by the fragment simulations. (8-mer, 12-mer, and 16-mer predictions for all targets are shown in Text S1.)

