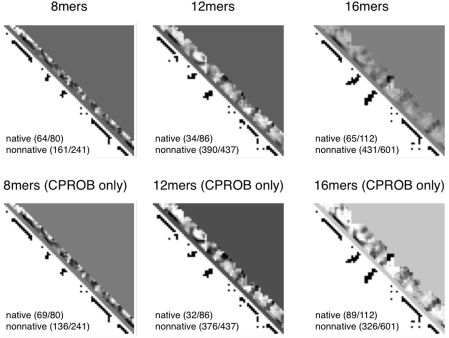
Figure 8. Logit values and prediction successes given by the best classification models for fragment simulations of 1whz.
The upper diagonal shows the logit scores  with prediction success rates. The lower diagonal shows native contacts in the range sampled by the fragment simulations. As the fragment simulations increase in length, clear signals of predicted secondary structures begin to emerge. For comparison (bottom row) are shown the logit values and prediction scores given by the best regression model trained only on contact probability. The similarity of the two models shows that most of the predictive power comes directly from the frequency of contacts observed in the simulation data.

