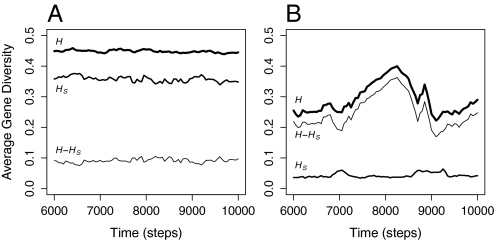
Fig. 3.
Total, within-group, and between-group gene diversity through time. (A) When CST = 0, the majority of the total average gene diversity is explained by diversity found within subpopulations. (B) When CST is much higher, between-group differences account for the majority of the total gene diversity through both the collection phase and the sweep phase. Each of the runs presented here, which are the same as those presented together in Fig. 2, is representative of a larger set of simulations.

