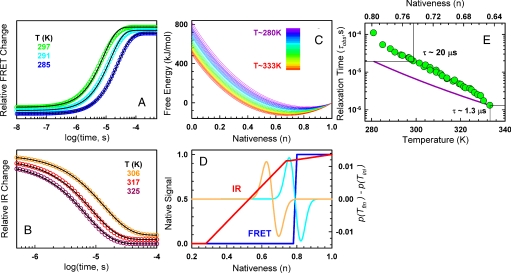
Fig. 3.
Quantitative analysis of time-resolved experiments. (A) FRET relaxation decays produced by the fitted model. As before, color code indicates the temperature, black curves are single exponential fits to the predicted decays. Note that the predicted relaxation corresponds only to the microsecond phase. The nanosecond phase is orthogonal to the folding process and thus is not accounted for by the model. (B) As in A, but for IR relaxations. (C) One-dimensional free-energy surfaces produced by the fitted model. The color code signifies temperature according to the scale shown in Inset. (D) Representation of how the FRET (blue) and IR (red) signals depend on the degree of nativeness, and examples of population redistributions after experimental temperature jumps: (cyan) T-jump to 294 K (orange) T-jump to 333 K. (E) Relaxation time of BBL as a function of temperature (lower scale) and the position of the free energy surface minimum on the reaction coordinate (top scale). Green circles, combined FRET and IR data; purple line, calculation for 40 kJ/mol activation energy using the value at 333 K as reference.

