Fig. 1.
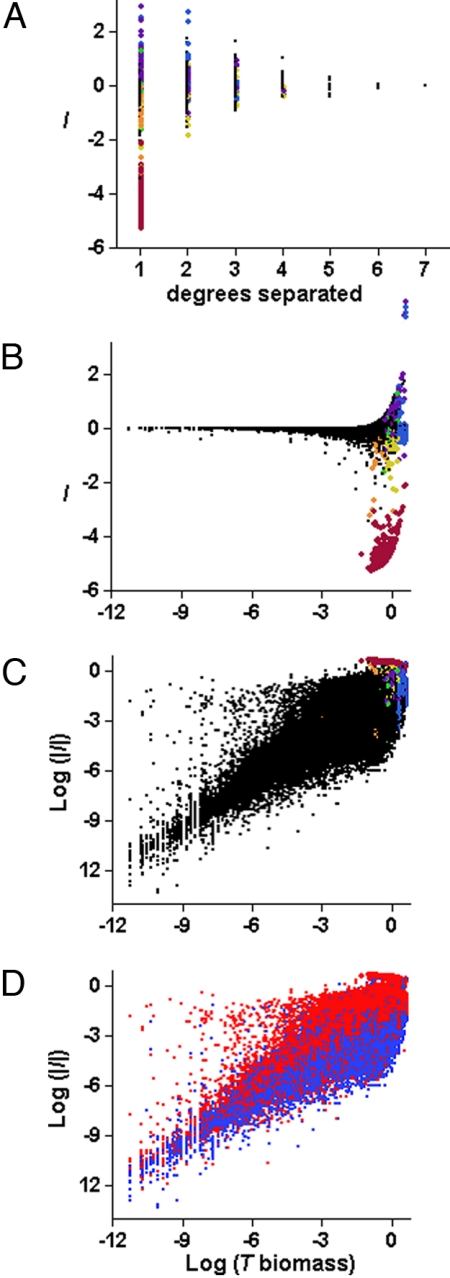
Explaining variation in the magnitude and sign of I. Untransformed population-level I as a function of (A) the degrees of separation between R and T, and (B) log10(BT+). Colored symbols highlight all of the CART leaves whose mean was within the top 5% strongest I. Strong negative I included one degree, “simple” (one path) effects of R on basal T where R is T's only consumer (dark red) or one of two consumers (orange), or “diffuse” (multiple possible paths) effects of high biomass R on high biomass T where the weighted sum of path signs <0 (yellow). Strong positive I included simple and diffuse effects of high biomass R on high biomass T where the weighted sum of path signs ≥0 (purple, blue, and green). (C and D) The same data as B but with log10|I| on the y axis. Color codes in C are the same as in A and B. Colors in D indicate upper (light red) and lower (blue) 50% quantiles of BR. Multiple linear regression: log10|I| = −1.34 + 0.71 log10(BT+) + 0.22 log10(BR), R2 = 0.65 and 0.63 in the training and test data, respectively. BT+ is the biomass of T with R present, and BR is the biomass of R.

