Fig. 2.
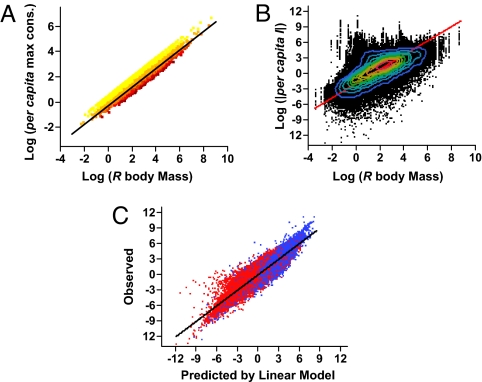
Body mass scaling and per capita interaction strengths. (A) Maximum per capita consumption as a function of body mass (input parameters); colors indicate increasing consumer generality from yellow to red; RMA regression: slope = 0.74 ± 0.003 (mean ± 95% CI), R2 = 0.90, n = 37,600 direct consumer-resource interactions. (B) Log10|per capita I| depending on log10(MR), where MR is the body mass of R.. Contour lines indicate 10% density quantiles from blue (low) to red (high). RMA regression model: slope = 1.38, R2 = 0.46. (C) Observed log10|per capita I| versus that predicted from the multiple linear regression: log10|per capita I| = −1.14 + 0.88 log10(MR) + 0.71 log10(BT+) − 0.79 log10(BR), R2 = 0.88. Colors are the same as in Fig. 1D.

