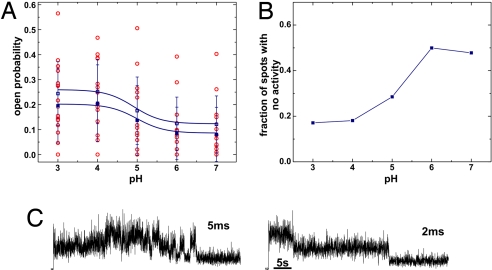
Fig. 3.
Open probability determined directly from fluorescence time traces. (A) Open probability of 1 subunit determined from the time traces (BF) considering that the closed subunit is bright and the open subunit is dark. The red spots are single values. Mean and SD are shown in blue. Filled symbols are mean of all values, open symbols are corrected values, which excluded all time traces with no activity (Fig. 3B). P = 0.014/0.006 (ANOVA). (B) pH dependence of fraction of spots showing no activity. (C) Image series (BF) were recorded with higher time resolution (5 and 2 ms, respectively). Whereas the signal-to-noise ratio decreased, no additional information was observed.

