Fig. 4.
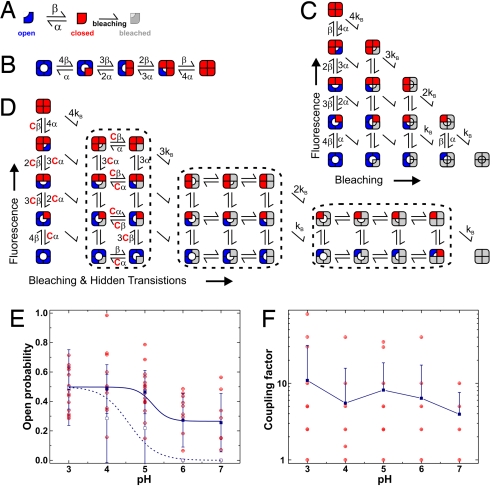
Markov model fitting of KcsA fluorescence time traces. (A) Each subunit may be in the fluorescent (closed, red) or nonfluorescent (open, blue) state. After bleaching, the states fuse into the bleached, nonfluorescent state (gray), where we cannot determine the state of the channel anymore. (B) If the subunits are independent, the rate constants for opening of a single subunit are multiplied by the number of closed subunits and so on. This model indicates the independent, nonbleaching channel. (C) Introducing irreversible bleaching into the model results in a 15-state model, where the bleached subunits (gray) have an undefined state of the bundle crossing. (D) If the subunits are not independent, we have to introduce an additional coupling constant (see text for details) so that the bleached subunits have an influence on the rate constants of the fluorescent subunits. (E) Open probability of a single subunit calculated from the rate constants α and β. Shown are the actual values (red) and mean ± SD (blue filled; P = 0.001 ANOVA). For comparison the channel open probability of KcsA-E71A-Q119C labeled with TMRM is given (blue open symbol). (F) Coupling constant resulting from Markov model fits of the time traces. Shown are single values (red) as well as mean ± SD (blue; neg. SD omitted in logarithmic scale).

