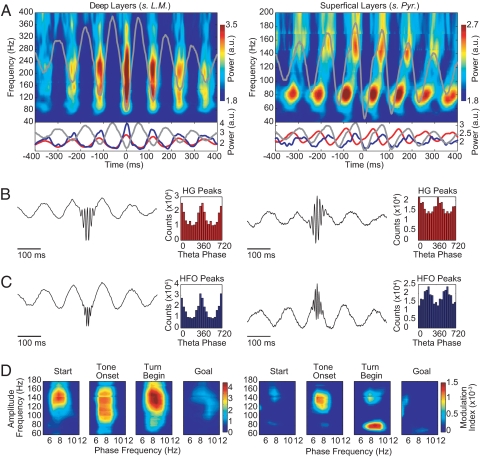
Fig. 4.
The theta phase modulation of high-frequency hippocampal LFP oscillations differs for rhythms in different frequency bands and layers in the CA1 region of the dorsal hippocampus. (A) (Upper) Time–frequency plots of the mean normalized power time-locked to the theta (7–12 Hz) trough for the deep (Left) and superficial (Right) CA1 layers recordings. (Lower) Plots showing the mean normalized power at 80 Hz (HG, red line) and at 160 Hz (HFO, blue line). The theta trough-locked averaged raw signal is shown in gray in all plots. (B and C) Averaged raw signal obtained by centering the LFP traces at the peaks of the HG (B) or HFO (C) and the corresponding histograms of the theta phases at which the peaks occurred. (D) Phase-to-amplitude comodulograms showing differential theta modulations of HG and HFO rhythms. Results are shown for simultaneous recordings from 1 deep (left column) and 1 superficial (right column) CA1 layer tetrode in a representative rat.

