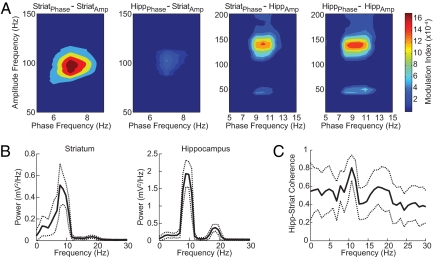
Fig. 5.
Phase-amplitude couplings occur between simultaneously recorded striatal and hippocampal oscillations. (A) Phase-to-amplitude comodulograms obtained during a 1-s interval around the Tone Onset task event. Results are shown for all phase–amplitude combinations as labeled. Note that the theta phase in each structure modulates the amplitude of oscillations in the other structure. (B) Mean power spectrum (solid line) of the LFPs recorded in each brain region during the same task period (Tone Onset), showing a peak in the theta band in both regions. Dashed lines represent ±SD. (C) Coherence spectrum (solid line) between the striatal and the hippocampal oscillations during the same task period showing a peak of coherence at ≈10 Hz. Results were obtained from a representative animal during a session (different rat than in Fig. 1).

