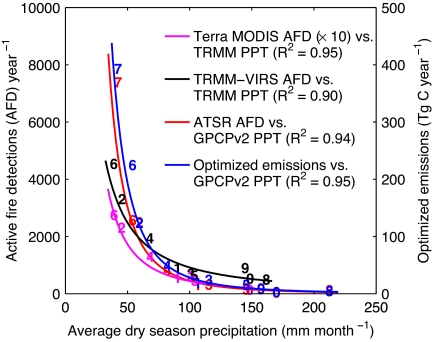
Fig. 3.
Relation between average precipitation rates during peak fire season and satellite-derived active fire detections (AFD). Optimized emissions for southern Borneo (south of 1°S), the region most impacted by ENSO-induced interannual variability in precipitation rates, are also shown. Because of variability in the timing of the dry season, here we defined average dry season precipitation as the mean monthly precipitation during the 3 consecutive months with lowest rainfall. The numbers in the graph denote the year (7 = 1997, 0 = 2000, 1 = 2001, etc., through 6 = 2006); correlation coefficients are based on a power fit. Data sources include TRMM (14) and Global Precipitation Climatology Project version 2 (GPCPv2) (36) for precipitation and TRMM-Visible Infrared Scanner (VIRS) (37), (Advanced) Along Track Scanning Radiometer (A)ATSR (38), and Terra-MODIS (20) for active fire detections. Differences in precipitation rates between GPCPv2 (2.5° × 2.5°) and TRMM (0.25° × 0.25°) are caused, in part, by differences in spatial resolution. The large fires in early 1998 in eastern Borneo burned outside this study region.

