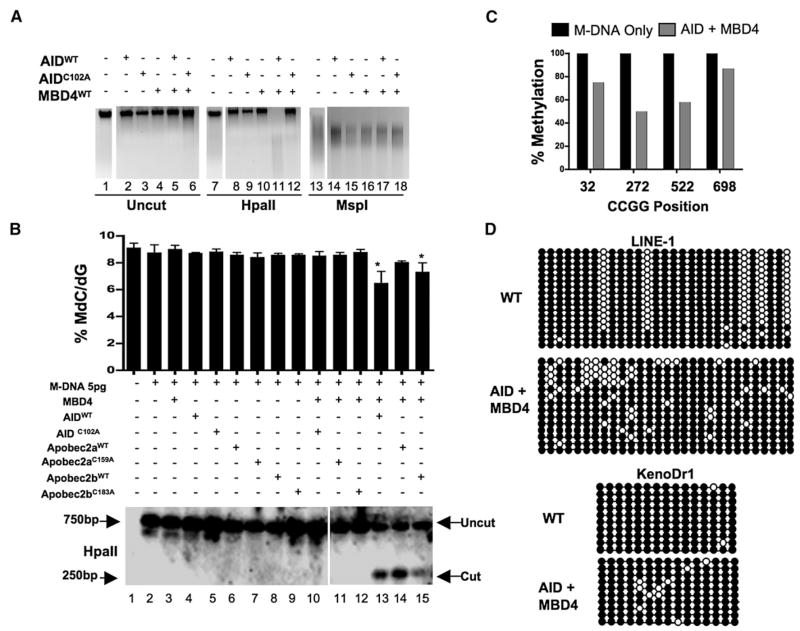
Figure 2. Overexpression of a Deaminase/Glycosylase Pair Elicits DNA Demethylation.
(A–C) Methylation status assessed by HpaII digestion of total genomic DNA (A), LC-MS quantitation ([B] upper panel), HpaII digestion of M-DNA (Southern analysis) ([B] lower panel), and bisulphite sequencing of M-DNA (C). Lanes 1, 7, and 13 in (A) and lane 1 in (B) correspond to wild-type sample. For (B), M-DNA was injected at 5 pg, below the threshold level for eliciting demethylation on its own (See Figures 1C and 1D). For (C), twenty clones were subjected to bisulphite sequencing, and the methylation status of each HpaII/MspI (CCGG) site reported as a percentage of total sites tested.
(D) Repeat elements from DNA isolated from embryos (13 hpf) injected at the single-cell stage with RNA encoding wild-type AID, along with MBD4 wild-type mRNA.
For each experiment, one representative of at least three biological repeats is shown except in LC-MS measurement where graph is prepared from values of two biological replicates. Asterisks (*) depict statistical significance (p < 0.05). Error bars are ± one standard deviation.

