
Figure 3.
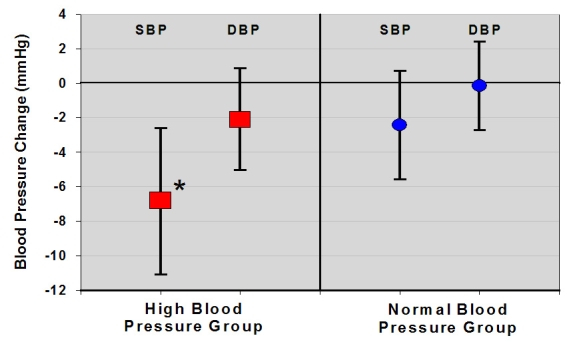
Mean (+ /- 95% CI) systolic and diastolic blood pressure change at 12 months in high and normal blood pressure groups (the systolic change in the high blood pressure group was significant, P < .001)
Official websites use .gov
A
.gov website belongs to an official
government organization in the United States.
Secure .gov websites use HTTPS
A lock (
) or https:// means you've safely
connected to the .gov website. Share sensitive
information only on official, secure websites.
Mean (+ /- 95% CI) systolic and diastolic blood pressure change at 12 months in high and normal blood pressure groups (the systolic change in the high blood pressure group was significant, P < .001)