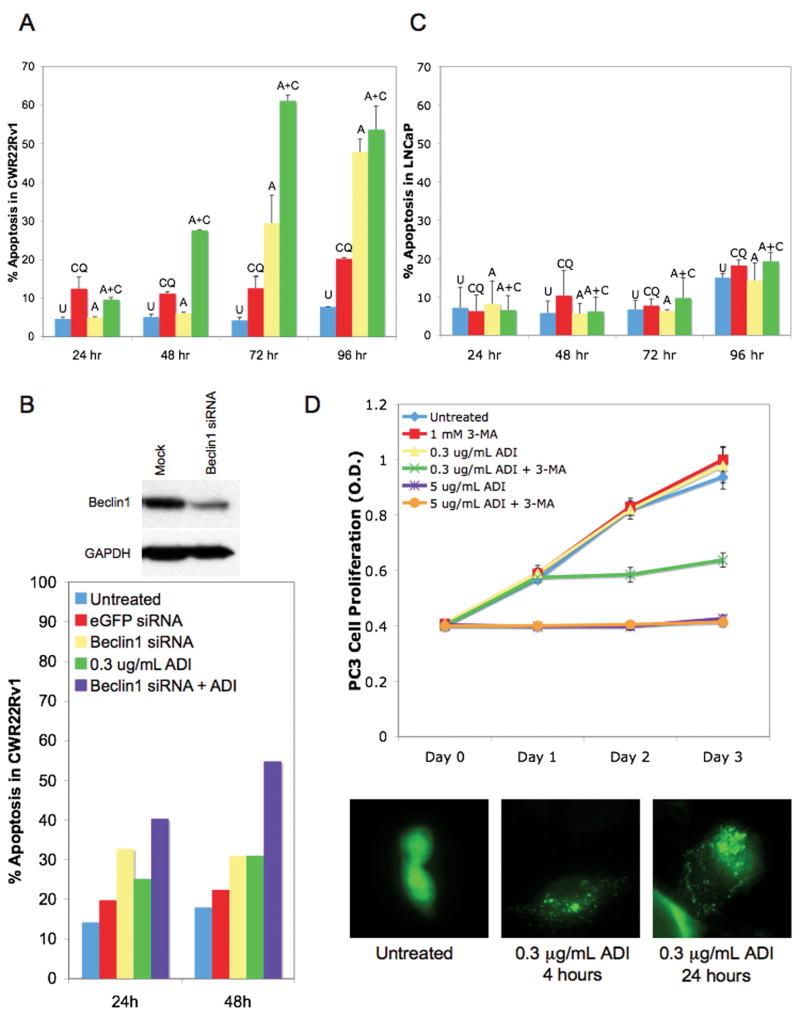
Figure 5. Inhibition of autophagy accelerates and enhances ADI-PEG20-induced cell death.
A, Timecourse of CWR22Rv1 cells treated with vehicle (untreated), 25μM CQ, 0.1μg/mL ADI-PEG20, or ADI-PEG20+CQ before FACS analysis for sub-G1 content. Values are reported as mean±SE. B, Immunoblot for CWR22Rv1 cells transfected with mock or 100pmol Beclin1 siRNA to assess knockdown. CWR22Rv1 cells were treated with vehicle (untreated), 0.3μg/mL ADI-PEG20, 100pmol eGFP siRNA, 100pmol Beclin1 siRNA, or Beclin1 siRNA+ADI-PEG20 for 24 and 48 hours before FACS analysis for sub-G1 content. C, LNCaP cells were treated and analyzed as described in A with 0.3μg/mL ADI-PEG20. D, Growth of PC3 cells were treated with vehicle (untreated), 0.3μg/mL ADI-PEG20, 1mM 3-MA, 0.3μg/mL ADI-PEG20+1mM 3-MA, 5μg/mL ADI-PEG20, or 5μg/mL ADI-PEG20+1mM 3-MA by MTT assay. Values are reported as mean±SD. PC3 cells overexpressing eGFP-LC3 were treated with 0.3μg/mL ADI-PEG20 for 4 or 24 hours. Punctae represent autophagosome formation. U=untreated, CQ=chloroquine, 3-MA=3-methyladenine, A=ADI-PEG20

