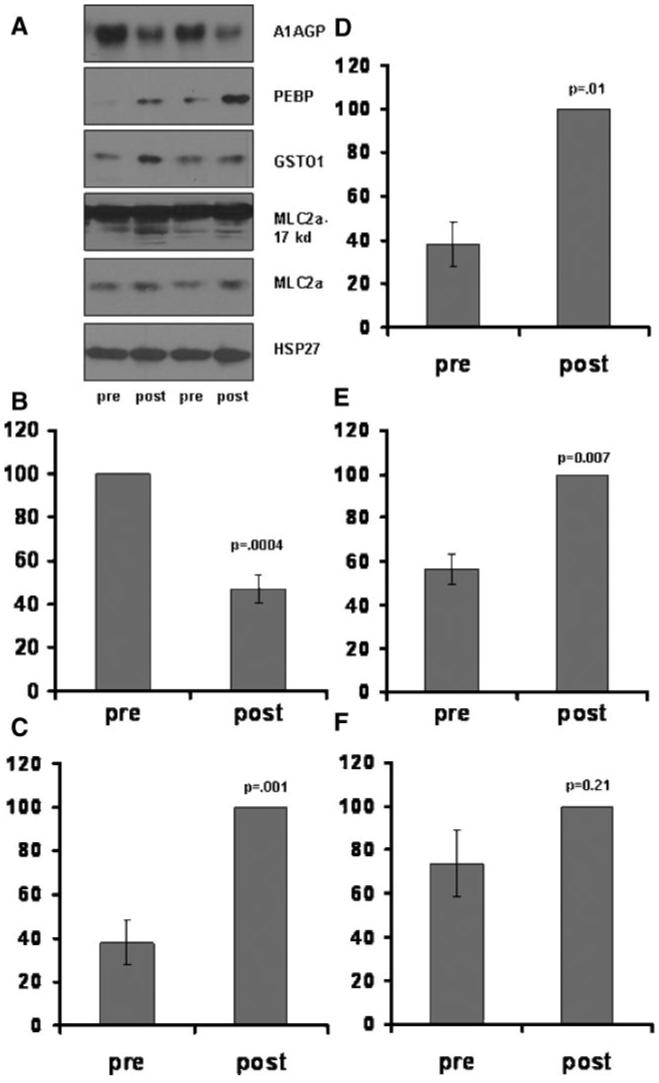
Figure 4.

Verification of abundance changes in identified proteins with specific immunoblot analysis. A, Representative immunoblots using specific antibodies to A1AGP, PEBP, GSTO1, MLC2a, and HSP27. Two representative patient samples are shown. Quantitave analysis of the data shown in A for: A1AGP (B), PEBP (C), GSTO1 (D), truncated MLC2a (E) (lower band/s, upper dark band is full length MLC2a), and full length MLC2a (F). Individual densitometry values were normalized to the % maximum response (pre or post) set to 100%. All proteins were corrected for loading differences using the densitometry value of HSP27. Minimum n=6.
