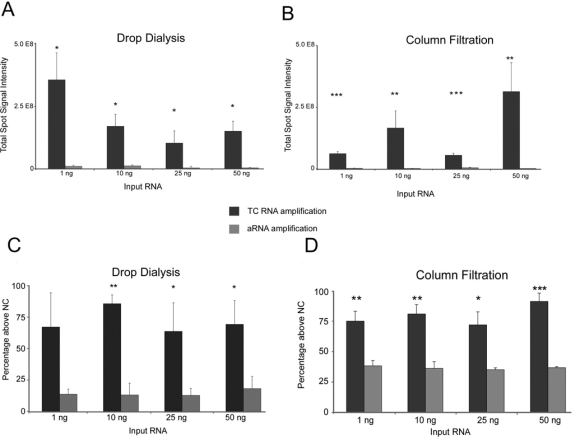
Figure 5.
TC RNA amplification and aRNA amplification following drop dialysis (A, C) and column filtration (B, D) as a function of hybridization signal intensity (A, B) and percentage above negative control (NC) values (C, D). Single asterisk denotes (p < 0.05), double asterisk denotes (p < 0.01), and triple asterisk denotes (p < 0.001).

