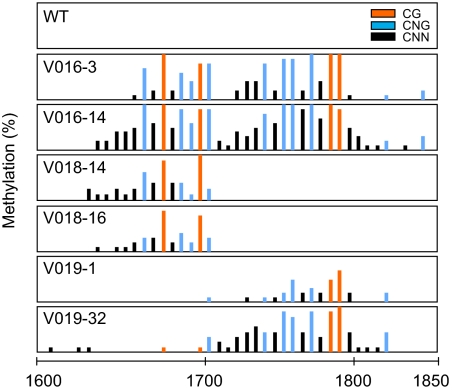
Fig. 2.
DNA methylation patterns in pMADS3 intron 2 of inverted repeat (IR)-expressed transgenic plants. V016 and V019 plants show the ect-MADS3 phenotype, whereas V018 plants show normal phenotypes. At least 9 clones are sequenced for each bisulfite-treated sample. Bars represent proportions of methylated clones at each site; red, blue, and black bars represent CG, CNG, and CNN sites, respectively. The scale represents nucleotide numbers in pMADS3 intron 2 with the first nucleotide of intron 2 as nt 1.

