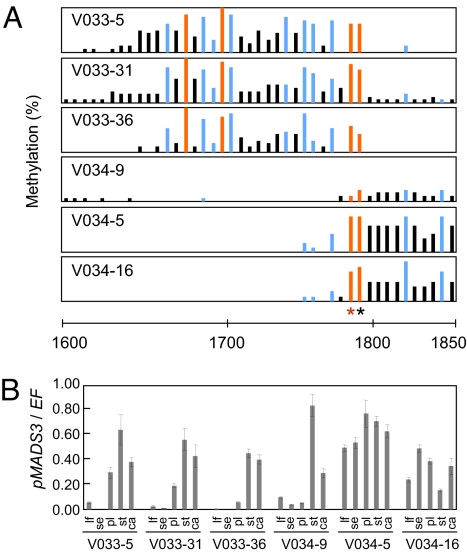
Fig. 4.
DNA methylation patterns and pMADS3 expression in V033 and V034 plants. (A) DNA methylation patterns in the 1600–1850 region. Bars represent proportions of methylated clones at each site; red, blue, and black bars represent CG, CNG, and CNN sites, respectively. The scale represents nucleotide numbers in pMADS3 intron 2 with the first nucleotide of intron 2 as nt 1. Asterisks indicate CG sites at nts 1768 (red) and 1771 (black). (B) pMADS3 mRNA levels in leaves (lf), sepals (se), petals (pl), stamens (st), and carpels (ca) of transgenic lines. Expression levels of pMADS3 relative to those of the elongation factor gene (EF) were measured by RT-qPCR. Mean ± SE (n = 3).

