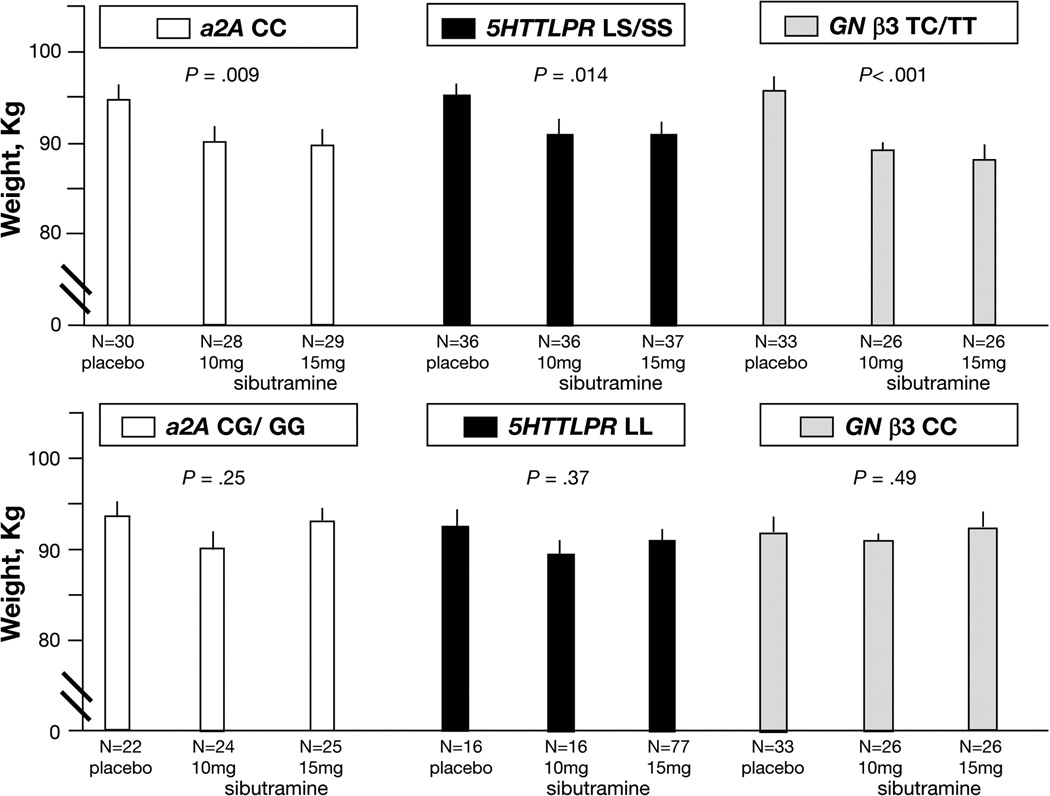
Figure 2. Relationship between 12-Week Post-Treatment Body Weight and Sibutramine Dose Based on Single Genotypes.
P-values indicate overall treatment effects for specific genotype. Least squares (adjusted for baseline weight and other covariates) means ± SE are plotted, unadjusted p-values from ITT analyses based on ANCOVA models. N refers to number of patients with complete data in each group. Upper panel identifies significant effects of sibutramine on post treatment weight in patients with the single genetic makeup indicated. Lower panel shows the corresponding treatment group values of post-treatment weight in patients with the alternative genetic variations for these single genes, and in which no significant treatment effects were detected.

