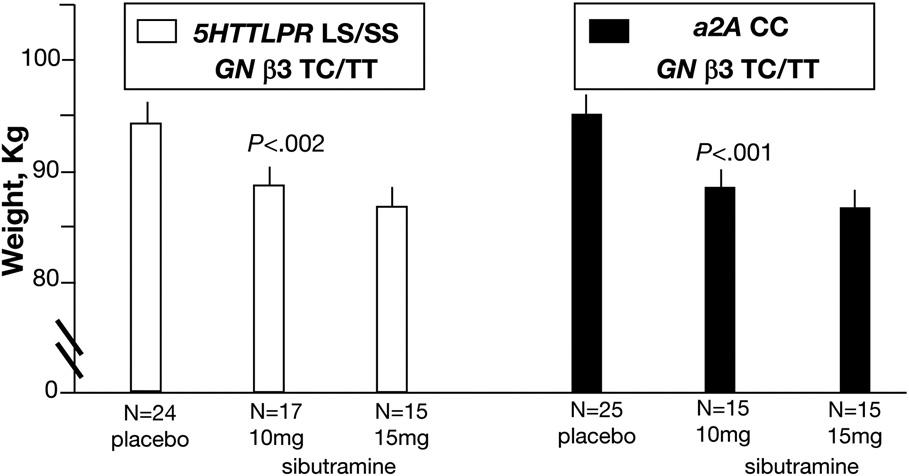
Figure 3. Relationship between 12-Week Post-treatment Body Weight and Sibutramine Dose Based on Gene Combinations.
P-values indicate overall treatment effects for specific genotype combination. Least squares (adjusted for baseline weight and other covariates) means ± SE are plotted, unadjusted p-values from ITT analyses based on ANCOVA models. N refers to number of patients with complete data in each group. There were significant effects of sibutramine on post treatment weight in patients with the specified genetic combination indicated.

