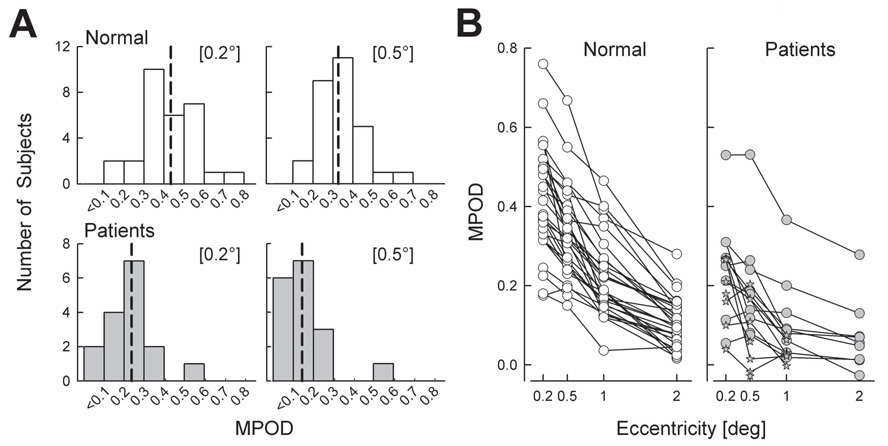
Figure 2. MPOD in patients compared to normal subjects.
(A) Frequency distribution histograms of MPOD measured at foveal locations (0.2° and 0.5°). Vertical dashed lines indicate median value of each distribution. (B) All individual MPOD values measured in patients and normals. Full profiles are shown with circles. Stars represent patient eyes in which MPOD could only be determined in a subset of the four eccentricities.

