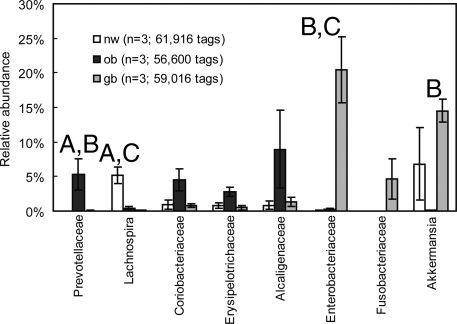
Fig. 2.
Bacterial families enriched in the ob and gb groups. (A) Significant (P < 0.05) difference between the nw and ob groups. (B) Significant difference between the ob and gb groups. (C) Significant difference between the gb and nw groups. Error bars represent the standard error of the mean (n = 3). The P values are based on the 2-sample t-test assuming equal variances.

