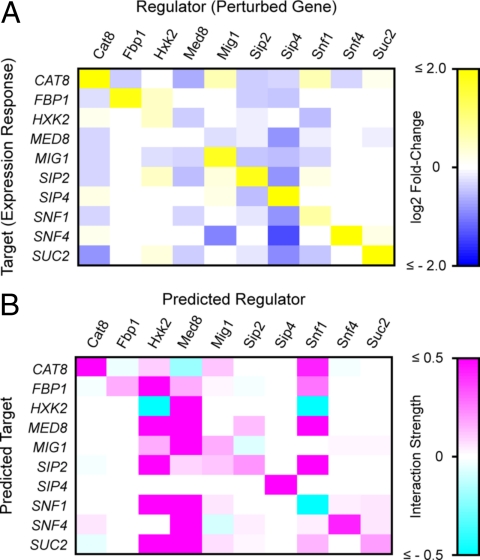
Fig. 2.
(A) mRNA expression profiling of network genes in response to systematic perturbations. Color intensities represent the magnitude of mRNA expression changes for each gene (Rows) in response to 2- to 4-fold over-expression of each other network gene (Columns), relative to an isogenic control strain expressing GFP. Values are log2-transformed ratios measured by quantitative RT-PCR, normalized by internal standard genes ACT1 and RDN18–1. Only significant expression changes (greater than the propagated standard error) were used for network model inference and are displayed here. (B) NIR-predicted transcriptional interactions in the Snf1 gene network. This matrix is a quantitative model of predicted regulatory influences. Color intensities denote the relative strength of regulators (Column vectors) upon mRNA expression of predicted target genes (Row vectors).

