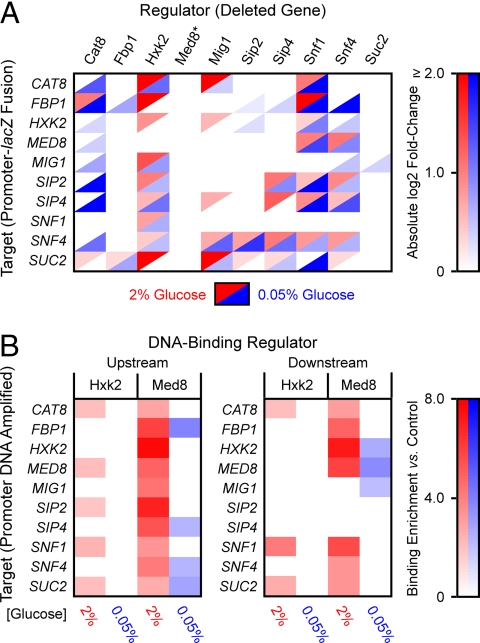
Fig. 3.
(A) Experimental confirmation of NIR-predicted functional interactions. Color intensities represent the absolute magnitude of ß-gal activity in deletion strains (Columns) expressing lacZ target-promoter fusions (Rows) relative to the same construct in the isogenic wild-type strain (BY4742). The essential Med8 protein (asterisk) could not be tested with this method. For clarity of presentation, absolute values of statistically significant (P ≤ 0.05) expression ratios are displayed. (B) In vivo ChIP-qPCR experimental results for regulators Hxk2 and Med8. Upstream denotes detection of Hxk2 or Med8 binding (Columns) to promoter DNA for each network gene (Rows); downstream indicates binding detected within the target coding region. Color intensities represent the ratio of enrichment of target DNA captured by immunoprecipitated Hxk2 or Med8 relative to control (isogenic wild-type strain BY4742), determined by real-time qPCR. Only statistically significant (P ≤ 0.10) expression changes are displayed.

