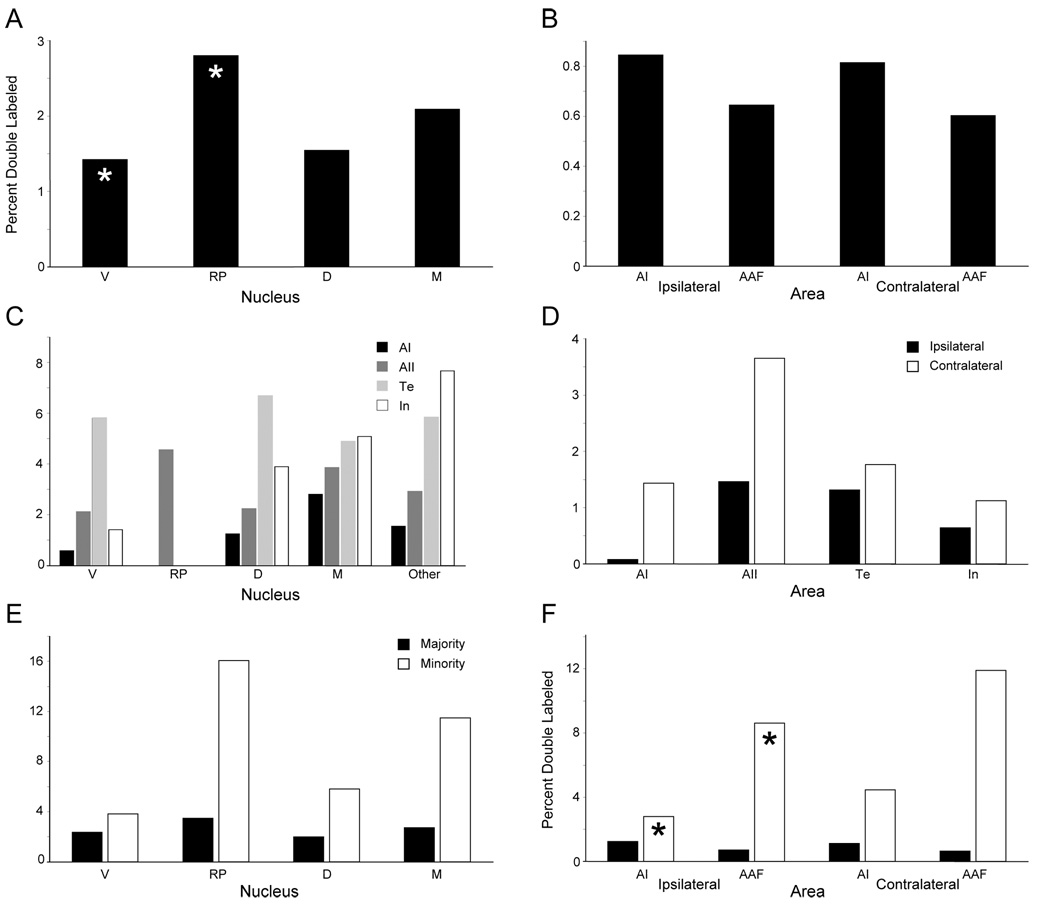
Fig. 3.
Percentages of double labeled neurons (PDLs). (A,B) PDLs in the MGB (A) and AC (B) after frequency-matched deposits of CTβ and CTβG in areas AI and AAF, respectively (Table 2). (C,D) PDLs in the MGB (C) and AC (D) ensuing from unmapped CTβ and CTβG deposits within the same area (Table 2). (E,F) After frequency-matched deposits in AI and AAF, a majority of labeled neurons in a given nucleus or area project to one area and a minority projects to the other. PDLs were calculated in the majority and minority populations of MGB (E) and AC (F) labeled neurons. Asterisks, significant differences (p<0.05; paired t-test). There is a significant PDLs difference as well between the minority and majority populations in all nuclei and areas (p<0.05; see text).

