
Figure 3.
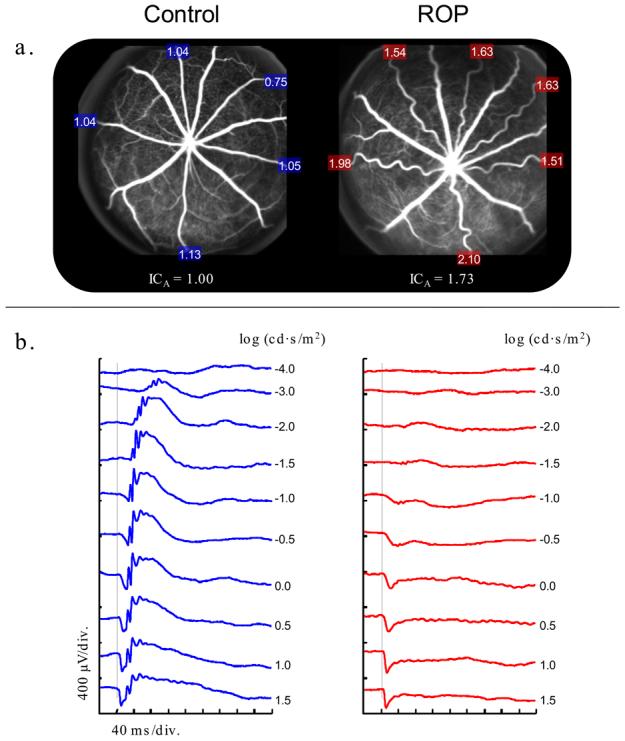
Rat model of retinopathy of prematurity. a. Scanning laser ophthalmoscope (SLO) images obtained using blue (488 nm) laser stimulation [42] after injection of fluorescein in 22 day old control and ROP rats. (Pigmented rats were used to facilitate SLO imaging.) The integrated curvature of each retinal arteriole is expressed as a proportion of the mean (ICA) in the control. The higher ICA value for the ROP rat reflects the greater tortuosity of its arterioles. The choroidal appearance is similar in the control and ROP fundi. (b.) Sample ERG responses to full-field stimuli [43] in control and ROP rats. Both rats were tested with the same flash intensities, as indicated. The vertical grey lines indicate the time at which the flash was presented.