
Figure 6.
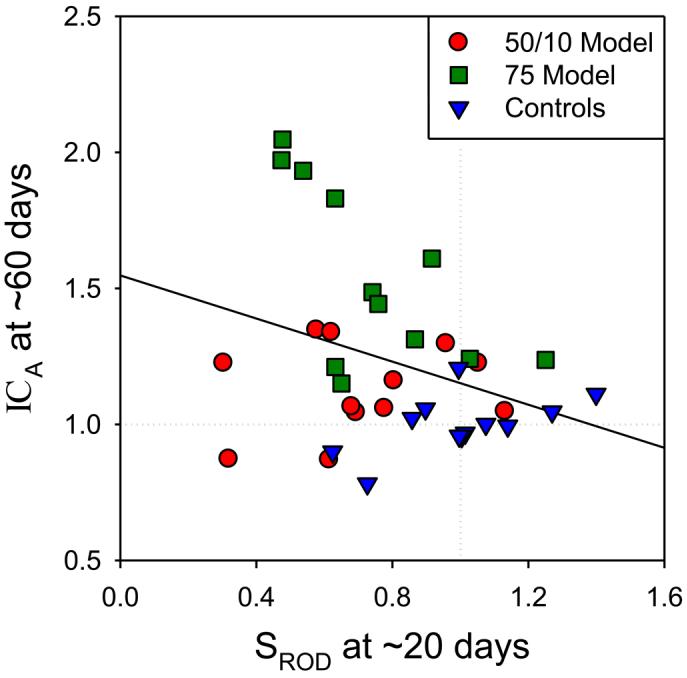
Arteriolar curvature (ICA) and photoreceptor sensitivity (SROD) in 50/10 model, 75 model, and control rats expressed as a proportion of the mean in controls (dotted lines). For each subject, ICA measured at ∼60 days is plotted as a function of that subject's SROD measured earlier, at ∼20 days. The solid line is a linear regression through all the data. Early rod sensitivity predicted vascular outcome (r = −0.332; P = 0.024). Adapted from Fig. 8, Akula et al. [5]; copyright Association for Research in Vision and Ophthalmology.