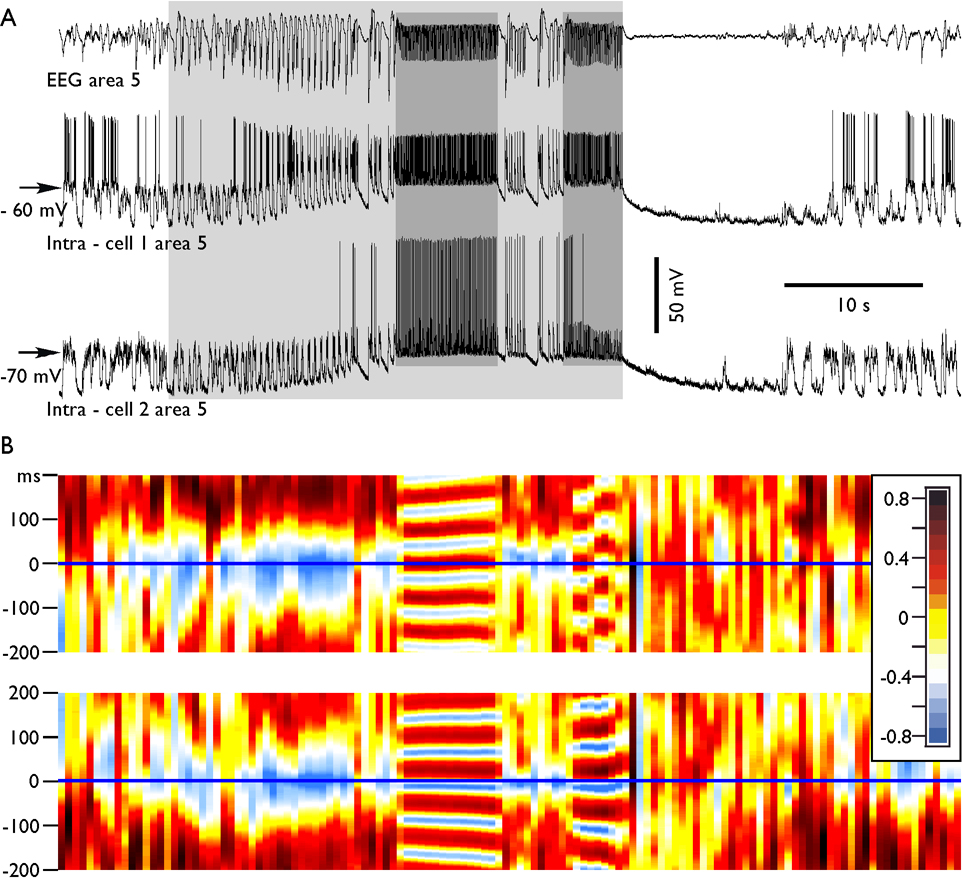
Fig. 2. Dynamics of cross-correlation during paroxysmal fast runs.
A. Depth-EEG and dual intracellular recordings during a seizure containing two periods of fast runs. B, the consecutive cross-correlations between EEG and neurons. The running correlogram was calculated as following: for a time interval of 1.0 s, the correlation function between two channels was calculated with correlation length ±0.2 s. Frame was then moved with a step of 0.5 s, correlation calculated, color coded, plotted, and so on. Each of correlated periods is represented as a single color strip in the bottom panels. Note that during spike-wave discharges the correlation between neuron and EEG was negative, as expected. During the first period of fast runs, the neuron 1 had reversed phase relations with EEG, while during the second period of fast runs the neuron revealed a patchy pattern. It oscillated several cycles in phase and another several cycles in counter phase; the neuron 2 oscillated in phase with the EEG during both spike-wave complexes and during both periods of fast runs.

