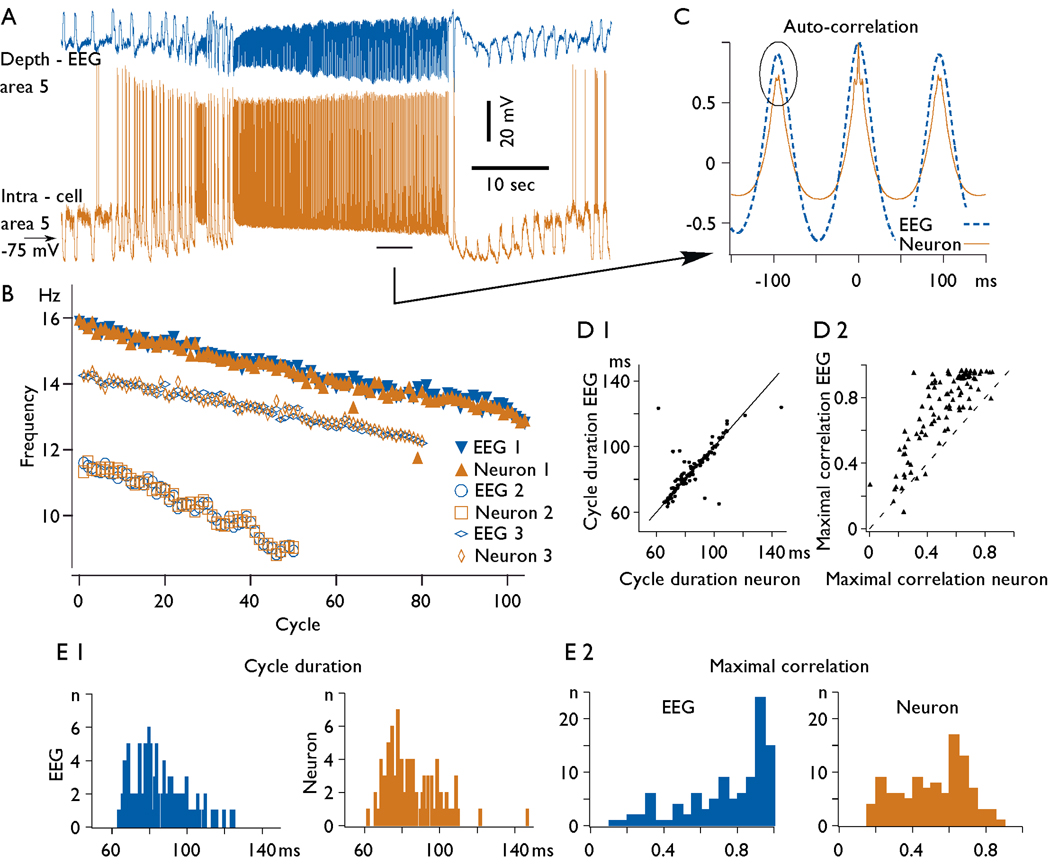
Fig. 6. Frequency of fast runs and their modulation during seizure.
A. An example of electrographic seizure containing a prolonged period of fast runs. B. Instantaneous frequency of oscillation during fast runs: filled symbols for field potential and neuron shown in panel A, empty symbols - examples from two other recordings. Note a progressive decrease in the frequency of the fast run. C. Autocorrelation of EEG and intracellular activities from 5 s period indicated in the panel A. Note, lower values of maximal correlation obtained from intracellular traces as compared to EEG traces indicated by oval. D 1. The frequency relation between EEG and intracellular recordings. and D 2. Maximal autocorrelation relation between EEG and intracellular recordings. Note that in the majority of cases the frequency of fast runs at EEG and intracellular levels was similar. In the vast majority of cases the amplitude of autocorrelation for EEG traces was higher then for intracellular traces. E 1. Histograms of cycle duration for EEG (left) and intracellular recordings (right). E 2. Maximal correlation values for EEG (left) and intracellular (right) recordings.

